Statistics Affiliate Professor and Computer Science Teaching Associate Professor, Wade Fagen-Ulmschneider is doing his part to save people by providing easy to understand visuals of crucial data points surrounding the spread of COVID-19. Deemed a “Data Science Wizard”by Popular Mechanics magazine for his 91-DIVOC project that flips the script on understanding the spread of COVID-19, Professor Fagen-Ulmschneider was gracious enough to provide an interview about his project.
Originally destined for vacation during Spring Break of 2020, Fagen-Ulmschneider found himself facing off against, and making sense of, the very threat that has since disrupted lives since the middle of March. As reports and talking points regarding the expansive growth and spread of COVID-19 swept the world, Fagen-Ulmschneider went to work and within two days released the first iteration of his 91-DIVOC project. As Popular Mechanics called it, “91-DIVOC is the easiest way to make sense of the essential data.” Fagen-Ulmschneider‘s visualization pulls real data from the John Hopkins repository and displays the data in various formats, making it easy to single out various points, such as confirmed cases, deaths, and recoveries.
Since going live with the 91-DIVOC project, over 70,000 daily visitors are viewing the information including governors of different states. The project has gained the attention of various media outlets as well such as The Verge and Popular Mechanics. With the newfound attention and additional resources Fagen-Ulmschneider has poured into the project we wanted to take a moment to talk to the data science wizard himself to see how the project has evolved and what this all means to him.
STAT: A lot has already been revealed on how and why you started the 91-DIVOC project and how it generates data. Since going live with your first visualization, how has this and corresponding projects evolved from initial conception to what they are now? Have they developed more than what you initially had set out or are they delivering how you anticipated?
Fagen-Ulmschneider: One of the basic principles I share with students in my classes on data visualization is the importance of using visualizations to present data in honest and transparent ways. In creating 91-DIVOC, I relied on those basic principles: the visualization uses data from trusted sources (Johns Hopkins University), the visualization allows you to mouse-over or tap on any point to dive into the raw data, and the visualization does not make any predictions or estimations about future data.
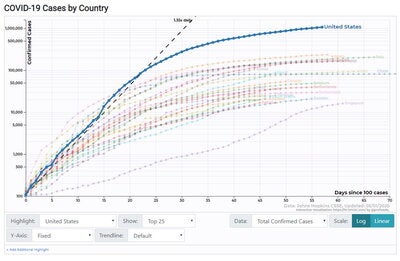
The very first release of the first 91-DIVOC visualization was inspired by a fantastic image created by John Burn-Murdoch at the Financial Times. In his work, he plotted the number of confirmed cases of COVID-19 for each country based on the date that each country reached 100 confirmed cases.
Unfortunately, it was just a static image and left me with more questions than answers and also left me curious about how the data looked using a linear scale instead of a logarithmic scale. Looking to answer these questions, I created a visualization to help me nerd out with the data.
Since the beginning, 91-DIVOC has allowed readers to explore the raw data for every single data point on the visualization. The core visualization has changed very little, but a wonderful community of people on social media suggested improvements and innovative ways to explore the data. With their suggestions, the 91-DIVOC visualization now allows readers to dive into all sorts of data to explore answers to questions they might have about the case data on COVID-19.
You’ve since released the second project in 91-DIVOC [one my family has actively used], you may not be ready to release or discuss other projects surrounding COVID-19, but if you are, what are your target goals and data sets you wish to spotlight?
Fagen-Ulmschneider: So humbling to hear that the ‘“COVID-19 Data for Locations of People You Love” project has proved useful to your family! I created the tool after I was checking the raw data every day for several days and looking at the data on the counties that mattered the most to me. I felt a tool that presented it would be easier for me, and shared it for others who might have also shared the same interests as me.
I’m honestly not sure what’s next – I’m currently focusing on finishing strong with an amazing group of students in STAT/CS/IS 107: Data Science Discovery, an introduction to Data Science that I have co-developed and have been co-teaching with Karle Flangan. As soon as finals are over, I hope to explore several new projects on 91-DIVOC.
Since releasing these projects and from a data scientist perspective, are there data sets or trends that you are noticing that many may not be aware of or are not necessarily noticing? Anything that could be seen as impactful if given the right understanding?
Fagen-Ulmschneider: I love to create accessible, honest, and interactive visualizations – and to work with students in creating amazing visualizations – but I don’t have any medical training or specific expertise about COVID-19. I’ve left the modeling and prediction of the future spread of COVID-19 to those experts.
From a purely data perspective, I am looking at near real-time data about what we’re doing as a country to see how people are responding to COVID-19. One specific dataset that I’m watching is the number of people screened at airport checkpoints by the Transportation Security Administration (TSA). The TSA updates this data every morning at 8am and it provides a fascinating glimpse into how we’re choosing to travel as a country.
And lastly… How does it feel to be recognized as a “data science wizard” by Popular Mechanics on such an important topic as COVID-19?
Fagen-Ulmschneider: One of my favorite quotes is by Gabe Newell, the co-founder of Valve, who spoke to a group of students learning to program and said, “The programmers of tomorrow are the wizards of the future. You are going to look like you have magical powers compared to everyone else.”
I’ve used this quote on the first day of class for years when teaching an introductory programming course (like here in 2015), but never have been called a wizard myself until this year. It’s particularly humbling to be named a data science wizard by Popular Mechanics, as I remember having their magazines around growing up. It is definitely a dream to be able to create something that they feel worthy of featuring.
Ultimately, I see this all as a small part in showing off the excellent Data Science we’re doing here at Illinois. I’m already sharing what I have learned from building 91-DIVOC and having it used by millions to understand the COVID-19 data with students and look forward to doing so in my future courses.